Just like many others, in 2012 I spent significant amount of time playing Diablo 3. While I enjoyed the experience a lot, playing the game also pushed me to think about its design. What I found most interesting was random loot system and auction house. Because of that, I recently started to think if I can produce simplified model of virtual currency economy in a game with random loot. Now, one very important caveat: I did not try to model Blizzard’s game. Diablo 3 is a very complex design with many variables, and for a technical designers/monetization guys at Blizzard was surely a big challenge. My model does not try to be complete, but rather give an insight into how an economy like that can behave, and perhaps give some ideas on how such economy can be regulated. It’s more like first step to making a game like that :)
Simulation basics
- The model consists of many independent players who interact with each other only through auction house. Think of it as an agent system. I run the simulations for 10 000 players, which I consider big enough.
- Simulation runs for 365 cycles
Items
In every simulation cycle, player gets random amount of newly generated items, which they can use, destroy, or sell. The amount of items generated is uniformly distributed between 25 and 75. Every item is one of 10 different types, and one of 10 item tiers. Tier 0 is the most common (worst), and Tier 9 is the rarest (best). Players seek best item of every type, either through finding an item, or through buying it from other players. Destroying items it the only currency source in the game, giving players 100 virtual gold for every destroyed item. When an item is generated, algorithm works as follows:
- It assigns an item to random type, with uniform distribution
- In the beginning an item tier is 0
- There’s X% probability that item is promoted to Tier 1
- If the promotion to Tier N succeeds and N<10, there’s X% probability of promoting it to Tier N+1
X depends on average tier of gear player already has:
- Tier <=2 - 10%
- Tier <=4 - 15%
- Tier <=6 - 20%
- Tier <=8 - 25%
- Tier >8 - 30%
The changing value of X simulates player progression through game: as player starts using better items, he/she farms more advanced content, so the chance of even better items dropping increases.
Player AI
The actions and decisions of players are probably the biggest leap of faith in this model. It’s really hard to imitate ingenuity of humans, after all :) Real people may try to play game like this as a trading game, do some strategic investments, try „last minute bidding”, or even exploit the market in ways that get you to prison if done in real life. Here, I decided to make player behavior as simple as possible. Here’s how simulation step for one player works:
- New items are generated and added to stash
- If any of the found items is better than one used, player always uses it, and puts item previously used to stash, in this step player also equips items that were bought (they are sent to stash outside of player simulation)
- Player finds 10 best (highest tier) items in stash, and lists them for sale, with initial price based on market data. These items are never better than ones used
- Player destroys all other items left in stash
- After that, players tries to upgrade items via bidding on available upgrades in the auction house. At first, player scans through owned items, and tries to upgrade worst one first. Player tries to find the highest tier affordable, and places “buy offer”, which blocks the amount of virtual currency equal to market price (transaction is initiated). Buy offer has to be at least 5% more than current price.
- Player repeats the bidding process for every item type
Market
Market operates in continuous way: occasionally after player logic finishes processing, market logic kicks in. It happens several times in a simulation cycle. Market does not control prices, players do it through bidding. However, it provides players price suggestion based on currently active offers, or last known price for an item if no offers for specific type/tier are present. Market logic itself does very simple thing - it picks up old enough offers and allows them to complete, either by returning unsold item to seller, or transfering an item to buyer and paying the seller item value, minus transaction 15% tax. This happens outside of player simulation - when player simulation is performed, player account already contains gold from sold items, and stash contains items successfully bought. Maximum offer age is set to 1.5 simulation cycle - so every single player in the system can act on it.
Simulation
I implemented this model in C++ and run the simulation for 10 000 players, over 365 cycles. Results are quite interesting, although they raise more questions than they answer. A first thing to do would be to look at player progression through game as time passes. In the model, average tier of items used by players is likely a good measure:
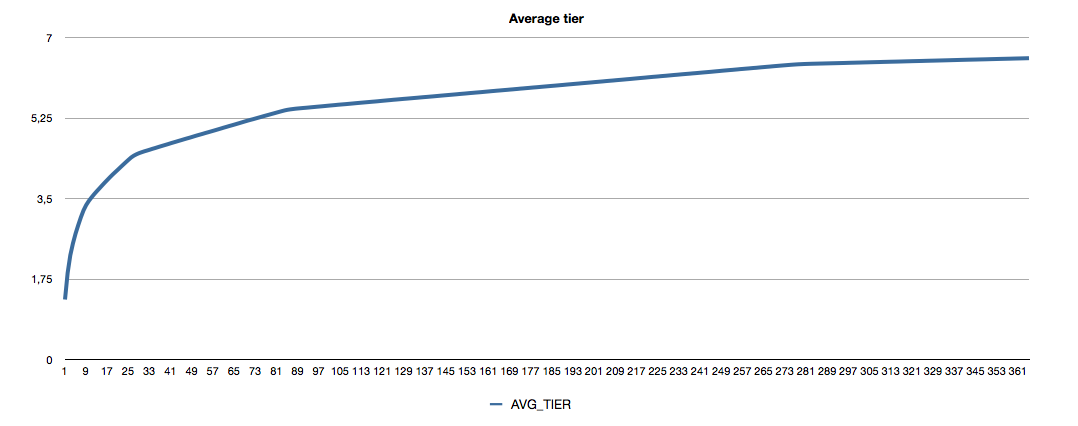
Looks nice, right? Player should progress quickly at first, and then the progress should gradually slow down. Well, it’s only an average. From single player perspective the picture is completely different. Lets look at how many players managed to do at least one upgrade in the simulation cycle:
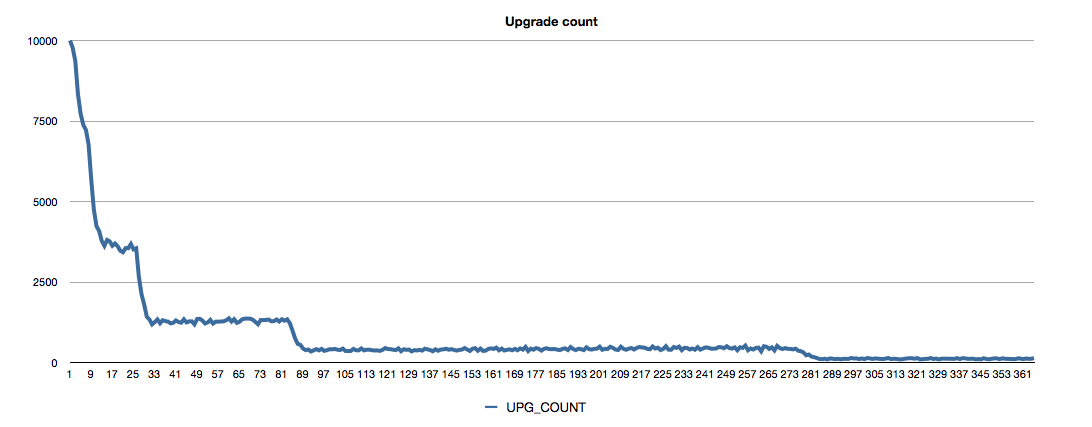
Ooops! This really hurts! We see bad things happening:
- The graph has steps, which means that there are relatively short periods when game conditions quite rapidly change, and upgrade frequency becomes much worse. These are likely moments when average tier of items in the population reaches next step. At this point market supply for items of previous tier rapidly goes up. How to make graph less stepped? Probably good idea is to make item quality continuous, not tiered. Other idea would be to make items valuable even if their tier is low - so that players have reason to use them for prolonged periods of time.
- The upgrade frequency for individual players becomes very low rather quickly. In an MMO game, it’s not unusual to have players who stay with the game for years. Yet, at the very end of this graph less than 1% of population manages to do any upgrade. In a real game, where you cannot count on having 100% retention, if player expected horizon for making any progress is 3+ months, that player is likely lost :) Here we can clearly see other need in design: give players other ways of making progress! If a game is centered around single number, this is bound to happen. Character damage in Diablo 3 is likely good example of such number that becomes very hard to upgrade forever. Paragon level system in the same game is an example of progress that happens even if primary item statistics stay the same.
Now the game economy. Here’s a graph of transaction count:
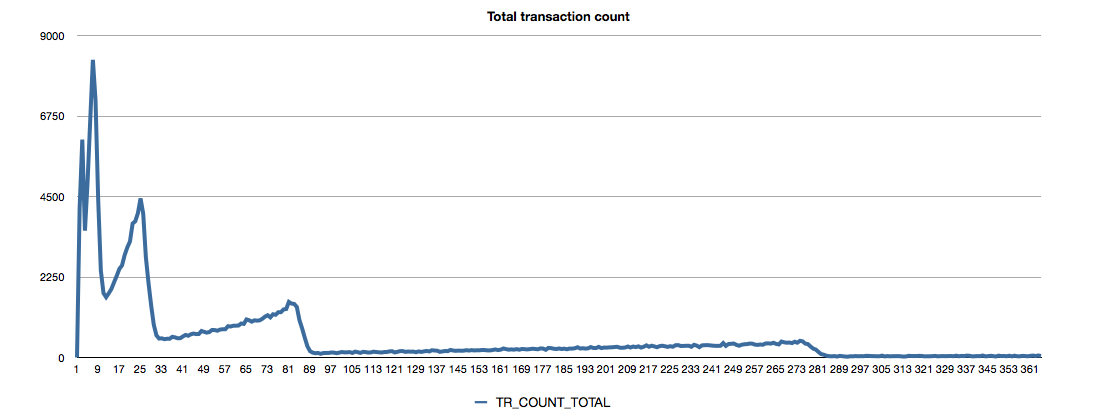
There are some similarities, although overall shape is more dramatic :( Eventually number of transactions, just like upgrade count goes down to near zero. One would think looking at this graph that game economy becomes dead in time. Not so fast! Let’s look at transaction volume (sum of all transactions in simulation cycle):
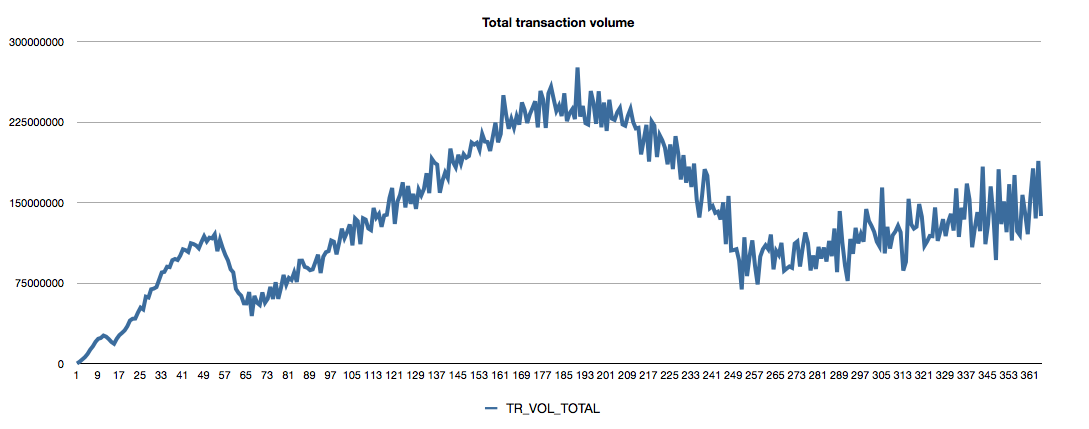
Looks different, doesn’t it? Having few transactions does not mean the economy is dead. The transaction volume also seems to go through cycles, but every cycle seems to have its maximum higher than previous one! The question is: does anyone want a virtual economy like this one?
If it directly correlated to real revenue it would be hard to just say „Yeah, we went down 50% this quarter, but it’s fine, just wait a bit” Fortunately, even if company profits from selling virtual currency or items, the relation between revenue and virtual market health is almost never that obvious. The simulation used to produce graphs above definitely deserves deeper look into. I already indicated that tiered nature of items may be at fault here. It is worth taking a look at what happens to specific item tiers, then :)
I divided the graphs into two separate sets, one for tiers 0-4, and one for tiers 5-9. The reason for this division is very simple: economy for items of tiers 0-4 was dead after <50 simulation cycles. Transaction count:
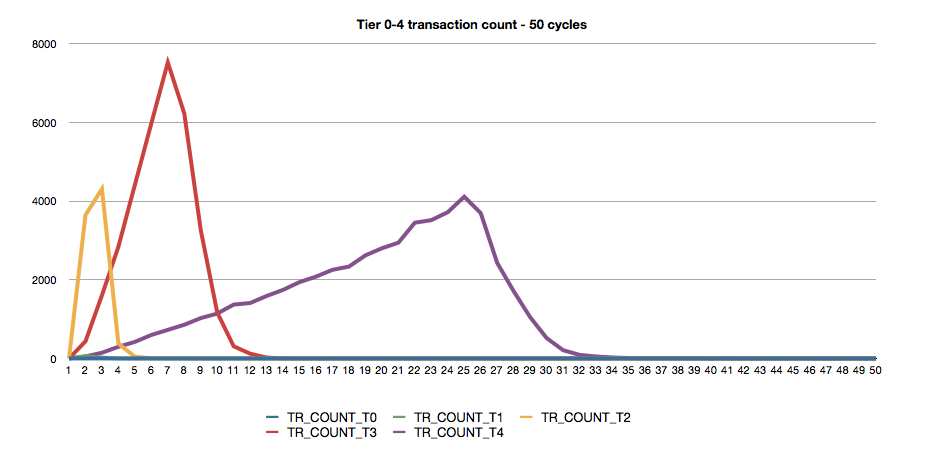
Item tiers 0 and 1 don’t even register on the graph, they were never traded. Another interesting thing about this graph is that once transaction count reaches peak value, it goes down even faster. This is essentially a market crash for items of this tier.
Now lets look at average price of items:
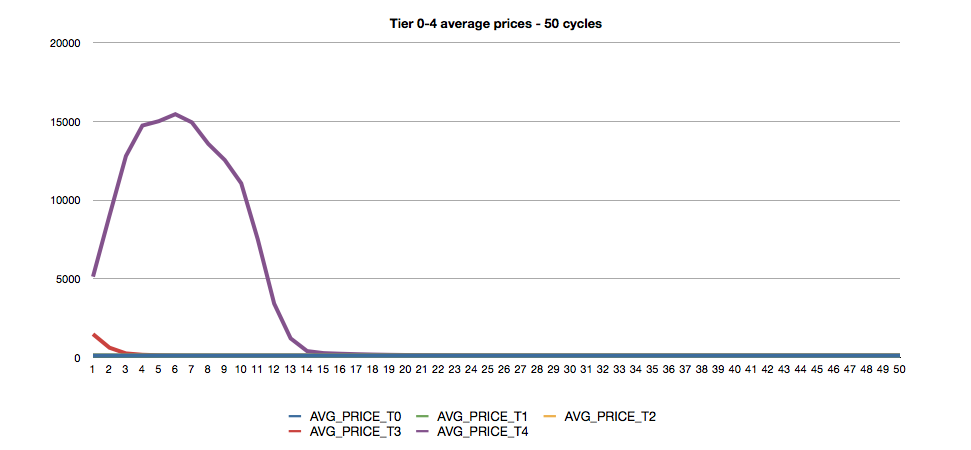
Prices started to fall down long before anything bad was visible in transaction count graph. Maximum transaction count for items of tier 4 happens long after value of these items hits its low.
This is all reflected in transaction volume split by item tier:
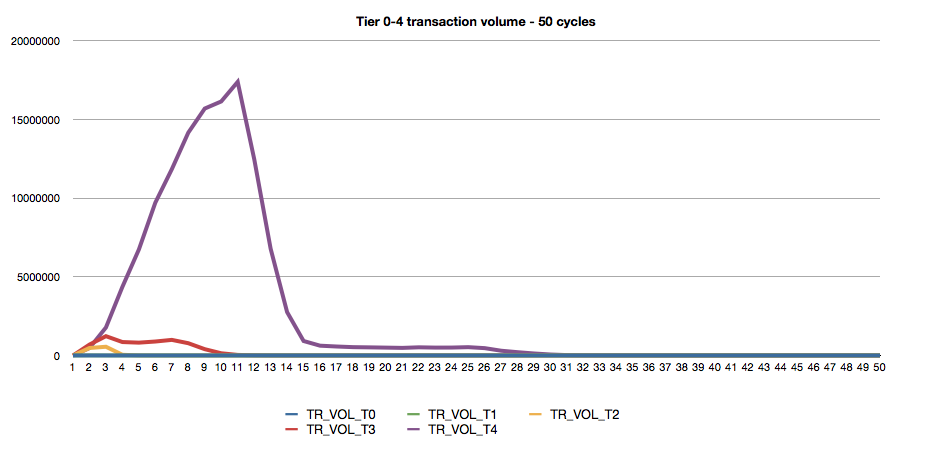
This is already a good indication into why total transaction volume graph looks the way it looks: it’s result of stacking data from separate tiers. While economy as a whole is alive, market for items of specific tiers grows and dies.
Let’s see if this repeats for higher item tiers. This is not obvious – probability of getting these items is quite low.
Transaction count:
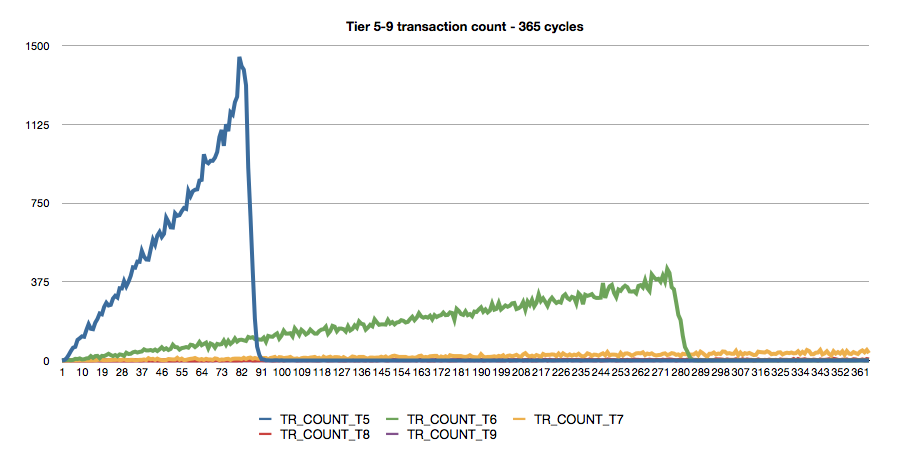
The story repeats itself. It doesn’t look good: what we can see on tiers 5 and 6 is that their transaction count gradually goes up, but after reaching their peak they essentially become untradeable over night.
How about average prices?
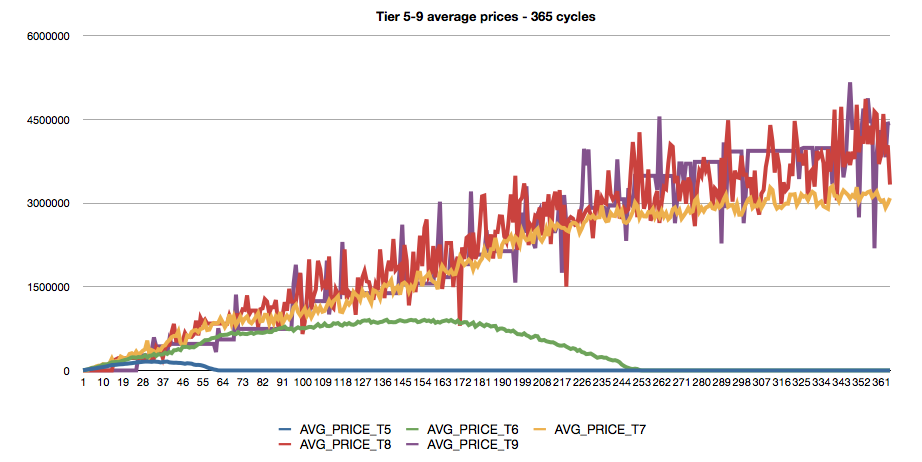
Again, transaction count peak happens long after price plateau is reached. One interesting thing: the prices of tiers diverge slowly. It’s more like they grow together but then lower tier just lets it go and stays behind. There isn’t really much difference in pricing between tier 8 and 9 on this graph. These items are best by and are acquired „at any cost”.
It is likely that price of absolutely best items will continue to grow for a long time. This probably is a good hint for MMO players: items are bad long term investment, unless they are absolutely the best game has to offer. Even then, there’s risk that developer will introduce some new items that are even better. Value of virtual currency does not go down as fast because there’s direct relation between currency amount and effort needed to obtain it.
Finally, transaction volume graph is not really suprising:
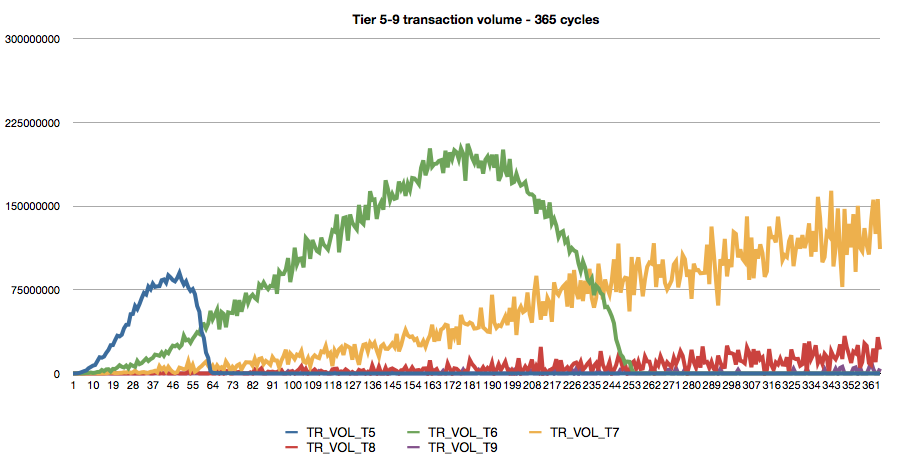
Again we see waves that go up, each one slower, but with higher peak. Given long enough time it would likely happen with higher item tiers.
Final thoughts
I hope that by now everyone realizes that making a multiplayer game with any kind of economy is not an easy thing to do. While people tend to come up with „easy fixes” that seem rational, any change to game rules may have profound effect on the economy, and by proxy on the community of players.
I would also like to stress that while I consider building models like that very important, it is also impossible to build a model that predicts reality. Simulations can validate or invalidate some design decisions, but after design is finalized and game launches, the story begins to be even more exciting, because that is the moment where model can be confronted with real player behavior data.
The code
The code for simulation is avalable on GitHub:
https://github.com/maciejmroz/LootEconomy
It’s standard C++ with some Boost libraries. Don’t judge me on code quality :) It is not pretty and could definitely use some refactoring. There are no comments or any other form of documentation, if you wish to modify it, you are on your own.
I compiled it on 64-bit Mac using Xcode and Apple LLVM compiler, but there’s nothing that prevents it from working on some other platform.